An umbrella review of effectiveness and efficacy trials for app-based health interventions

Study selection
The study selection process according to PRISMA requirements14 is summarized in Fig. 1. The database search yielded a total of 1895 records, with additional 2513 records identified through forward and backward citation searching of records from the initial search deemed eligible after full text screening by the first author. After de-duplication, 4253 articles were screened by title and abstract. Of these, 3892 records were excluded, and 361 records were included for full text screening. The final number of included articles was 48. Inter-rater reliability (IRR) for title-/abstract screening and full-text screening was κ = 0.3469 and κ = 0.9326, respectively. A list of the 313 studies excluded after full-text screening with exclusion reasons for each study can be found in Supplementary Table 1.
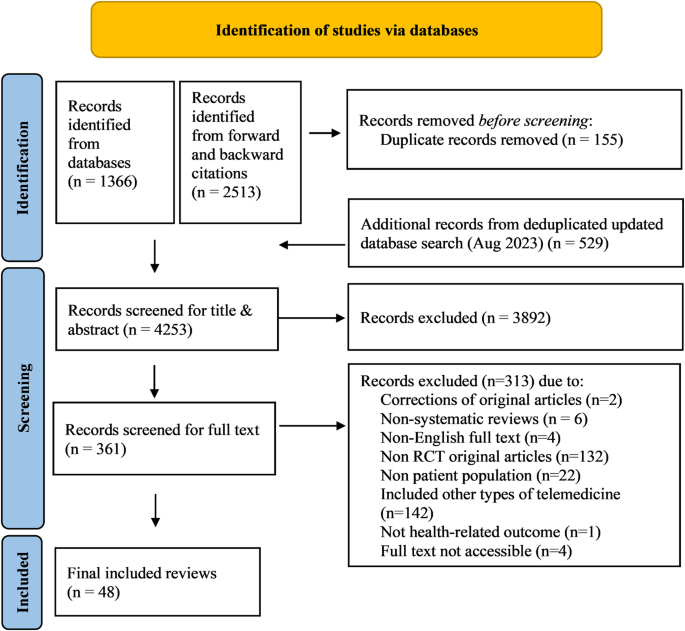
Flow chart illustrating the process of study identification for the present umbrella review with database searches (last updated on August 28, 2023), deduplication, title and abstract screening as well as full-text screening, leading to a final inclusion decision for n = 48 systematic reviews.
Review characteristics
Included reviews were published between 2013 and 2023, with the highest number of reviews published in 2020 (n = 10) and the first three quarters of 2023 (n = 9) (see Fig. 2).
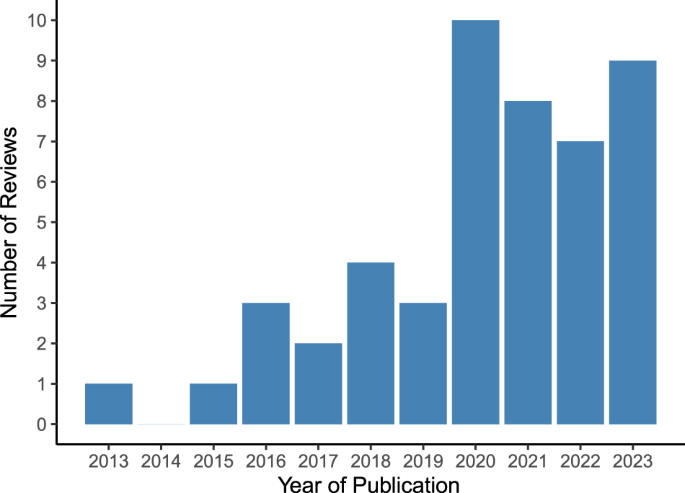
Vertical bar chart illustrating the number of included systematic reviews (n = 48 in total) on the y-axis stratified by year of publication on the x-axis.
All included reviews considered articles without geographic restrictions, except one focusing on China15. The number of RCT studies included in a review ranged from two to 36. Out of the 48 included reviews, 3515,16,17,18,19,20,21,22,23,24,25,26,27,28,29,30,31,32,33,34,35,36,37,38,39,40,41,42,43,44,45,46,47,48,49 conducted data pooling and meta-analyses whereas 13 reviews50,51,52,53,54,55,56,57,58,59,60,61,62 provided a narrative synthesis without meta-analysis. Median follow-up periods ranged from 1 to 10 months, with no respective information reported in six reviews15,31,32,33,50,53. A summary of review characteristics is shown in Supplementary Table 2.
Methodological quality
Figure 3 summarizes the frequency of each AMSTAR2 rating for each domain across reviews. Supplementary Fig. 1 additionally presents the domain-specific methodological quality ratings for each review.
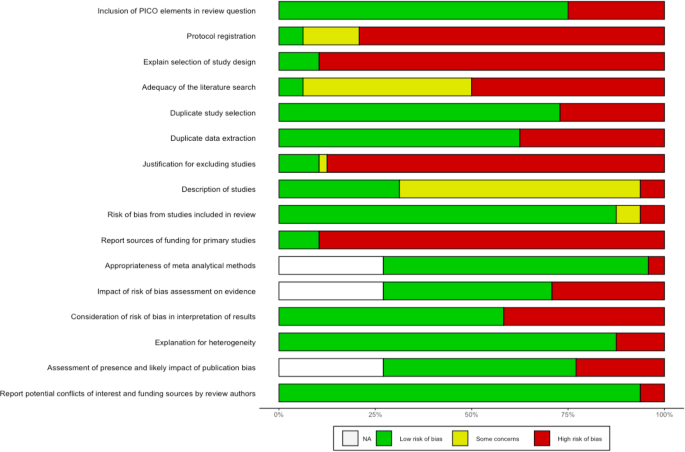
Horizontal stacked bar chart illustrating on the x-axis the share of the n = 48 (100%) included systematic reviews which was rated as either low risk of bias (green), showing some concerns with regard to bias (yellow) or high risk of bias (red), for each of the 16 AMSTAR items (listed on the y-axis), respectively. White bar stacks represent the share of systematic reviews without meta-analysis, to which AMSTAR2 items 11, 12, and 15 were not applicable (“NA”). The acronym PICO in the first AMSTAR2 item stands for Population, Intervention, Comparator, Outcome.
Sixteen reviews stated that they had registered or otherwise published a review protocol17,19,25,34,35,38,40,41,42,47,48,51,54,56,60,62. After checking these protocols, thirteen were rated as incomplete as they missed information on the search terms defining the search strategy (item 2)17,19,34,38,40,41,47,48,51,54,56,60,62. All reviews searched at least two databases and provided their full search strategy in the final report, but 25 reviews16,17,19,21,22,27,28,29,33,38,39,41,43,45,47,48,49,50,52,53,54,55,58,59,61 failed to justify publication restrictions, for example regarding language, entailing a “no” on item 4. Six reviews provided a list of studies excluded at full-text screening stage (item 7)26,37,42,48,56,57. Overall, a satisfactory assessment tool for risk of bias was used (item 9). Three reviews reported conflicts of interest (item 16)16,42,49. We rated one review as moderate quality56. IRR for quality assessment across all items and reviews was κ = 0.6671. Item-specific IRRs can be found in Supplementary Table 3.
Extraction results
Included RCTs covered populations from all continents, with a majority of studies conducted in high- or middle-income countries such as the United States, China, Australia, United Kingdom, Spain, Norway and Japan. Seven reviews33,38,45,46,48,49,50 did not report countries of included studies.
An overview of covered health indications is displayed in Supplementary Fig. 2 and, in more aggregated disease groups, Fig. 4. Most reviews targeted specific indications, including type 2 diabetes (T2DM) (n = 5)19,20,22,23,26, hypertension (n = 4)15,27,31,38, depression (n = 3)33,53,61, overweight/obesity (n = 3)40,41,52, chronic obstructive pulmonary disease (COPD) (n = 2)35,39, urinary incontinence (n = 2)56,62, asthma (n = 1)57, autism spectrum disorders (n = 1)32, post-traumatic stress disorder (PTSD) (n = 1)59, type 1 diabetes (n = 1)47, Parkinson’s disease (n = 1)45, knee arthroplasty (n = 1)46 and lower back pain (n = 1)51. Twenty-two reviews covered multiple conditions within their scope, such as diabetes of various types (n = 7)18,21,24,25,36,37,50, chronic non-communicable diseases (n = 2)55,58, anxiety and depression (n = 2)43,49, conditions requiring rehabilitation (n = 2)42,44, pediatric diseases (n = 1)54, diseases requiring medication (n = 2)17,34, cardiovascular diseases (n = 2)16,30, pain conditions (n = 2)48,60, mental illnesses (n = 1)28, or a combination of diabetes and hypertension (n = 1)29.
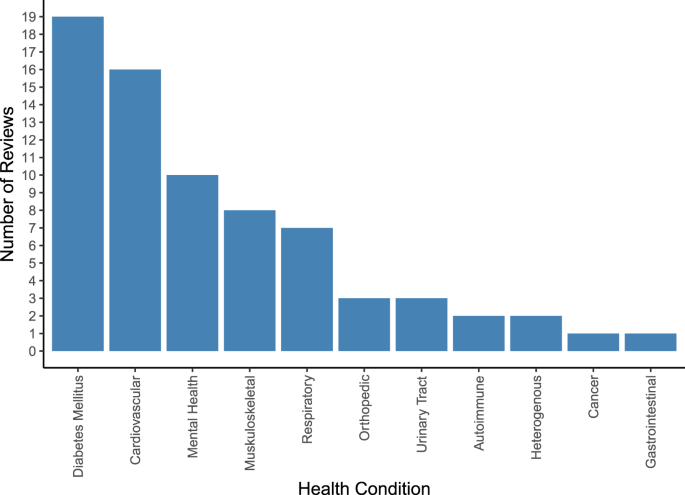
Vertical bar chart illustrating the number of included systematic reviews (on the y-axis) covering each of the 11 aggregated groups of health conditions (on the x-axis) which we identified across the n = 48 included systematic reviews. The total number of systematic reviews included in the graph exceeds the number of included systematic reviews as some systematic reviews cover more than one group of health conditions. Cardiovascular conditions include hypertension, stroke, obesity, atrial fibrillation, heart failure, myocardial infarction, coronary heart disease, hypercholesterolemia, prediabetes and cardiovascular disease. Diabetes mellitus includes type 2 diabetes, type 1 diabetes, diabetes, and gestational diabetes. Musculoskeletal conditions include fibromyalgic syndrome, musculoskeletal disorders, chronic pelvic pain, chronic musculoskeletal pain, multiple sclerosis, chronic low back pain, chronic neck pain, non-specific lower back pain, unspecified chronic pain, chronic pain or fibromyalgia, Parkinson, and neurological disorders. Mental health conditions include depression, anxiety, bipolar disorder, autism, post-traumatic stress disorder, attention deficit hyperactivity disorder, and schizophrenia. Respiratory conditions include asthma, chronic obstructive pulmonary disease, lung transplant, allergic rhinitis, and chronic lung disease. Autoimmune conditions include autoimmune deficiency syndrome and psoriasis. Orthopedic conditions include osteoarthritis, spina bifida, and post-operative knee aristoplasty. Urinary Tract Disorders include urinary incontinence and interstitial cystitis. Heterogenous diseases include unspecified chronic diseases and multimorbidity. Cancer includes chemotherapy related to cancer toxicity. Gastrointestinal conditions include irritable bowel syndrome. For a more detailed illustration of frequencies for all 49 ungrouped individual health conditions, see Supplementary Fig. 2.
Information on pooled sample size was provided by all except three reviews31,45,46 and ranged from 282 to 7669 patients. Further information on extracted population characteristics can be found in Supplementary Tables 4 and 5.
The health apps performed a wide array of functions including symptoms monitoring and assessments, medication reminders, real-time biofeedback, personalized programs and education, tailor-made motivational messages or cues and feedback, social support, communication with healthcare professionals, goal setting, data storage, and visualization.
A summary of reported app characteristics and functionalities is documented in Supplementary Table 4.
Comparator conditions were described in 43 out of the 48 reviews. Some reviews included usual care comparators only, others varied between usual care or other control apps, to lighter technological features, text messages, paper-based monitoring diaries, in-person and standard education, and no treatment. A summary of reported comparators is shown in Supplementary Table 4.
Eleven reviews reported results on T2DM patients. Five focused on T2DM alone19,20,22,23,26, while six included broader populations but conducted (subgroup) analyses specifically on T2DM21,24,25,36,37,58. All eleven reviews except one19 assessed glycemic control, operationalized as change in glycated hemoglobin (HbA1c) reduction, as main or secondary outcome. Further outcomes comprised changes in body weight, waist circumference or body mass index19,20,22,23, fat mass or percentage of body fat19, lipids, blood pressure, lifestyle changes, medication use20,22,23, psychological symptoms and quality of life (QoL)23. All studies that focused on other types of diabetes (e.g., type 1 diabetes, mixed types, prediabetes, gestational diabetes)18,36,37,47,50 focused on HbA1c changes as main outcome, while only a few included adverse events37,54 and QoL54. Another outcome reported for diabetic populations was medication adherence, but it was reported in samples that did not exclusively include diabetes patients (patients with prescription drugs16, chronic disease patients34,54).
Reviews including patients with hypertension focused on evaluating the impact of health app interventions on medication adherence27,31,38, systolic and diastolic blood pressure15,27,38, and health behaviors27,38. Three reviews16,17,34 reported on medication adherence, and two reviews16,29 on systolic and diastolic blood pressure, lipids and anthropometric outcomes in samples that did not exclusively include hypertensive patients.
Reviews focusing on patients with depression measured improvements of depressive symptoms33,53,61, and self-esteem and QoL53,61. Two reviews additionally reported results for medication adherence17,61, one61 on psychiatric admissions, medication adherence and side effects, resilience, attitudes, sleep disturbances and further psychological and behavioral outcomes61. Further reviews reported on depressive28,43,49, mania and psychotic symptoms as well as adverse events28 and anxiety symptoms43,49 in samples that did include depression patients, however not exclusively. Outcomes evaluated in other mental health indications included symptoms related to PTSD59, positive and negative psychotic symptoms including hallucinations or delusions and absence of experience (in schizophrenia), mania and depression symptoms (bipolar disorder)28, and autism-related outcomes based on the Mullen Scales of Early Learning, MacCarthur-Bates Communication Development Inventory and Communication and Symbolic Behavior Scales32.
Reviews focusing on overweight and obesity used the following outcomes: weight loss40,41,52, waist circumference, blood pressure, lipids, HbA1c, energy intake40,41, physical activity, body fat, BMI40, motivation and adherence52.
Outcomes reported in other indications can be found in Supplementary Tables 4 and 6.
Figure 5 illustrates the types of outcomes reported in the systematic reviews by aggregated groups of investigated health conditions. More details on the uncategorized outcomes can be found in Supplementary Tables 4 and 6.
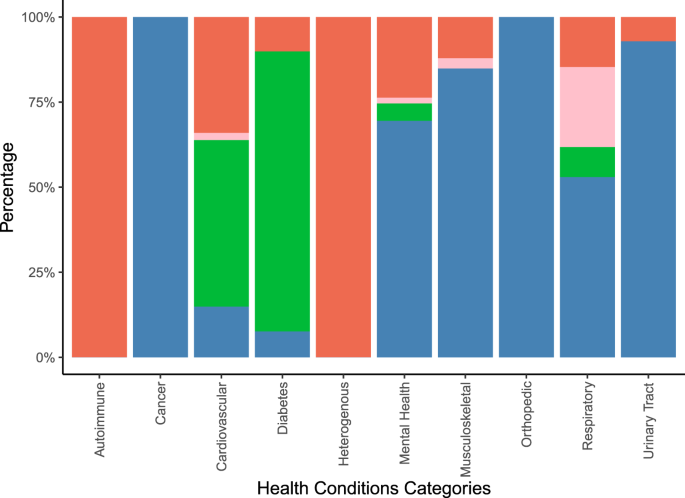
Vertical stacked bar chart illustrating the percentage of behavioral (red stacks), healthcare resource utilization (rose stacks), laboratory/anthropometric (green stacks), and patient reported (blue stacks) outcomes on the y-axis by aggregated groups of health conditions (on the x-axis) covered in the total of n = 48 included systematic reviews. Behavioral outcomes comprised behaviors such as medication adherence and physical activity. Healthcare resource utilization comprised outcomes such as hospitalizations, and doctor visits. Laboratory/anthropometric outcomes included clinical or body measurements. Patient-reported outcomes comprised subjectively reported outcomes such as quality of life or symptom improvement.
Twenty-three out of 35 meta-analyses conducted subgroup analyses18,19,20,21,23,24,25,26,27,28,29,33,34,36,37,40,41,43,47,48,49,53,57. Investigated subgroups were defined by number, types and intensities of app features, differentiation between standalone or integrated interventions, baseline demographic or disease-related participant characteristics, follow-up duration, intervention duration, study quality, type of comparator, sample size, attrition, analytic approaches, and outcome assessment methods. Summaries of the subgroups investigated are in Supplementary Table 7.
Overall, 41 out of the 48 reviews concluded that app-based health interventions were effective in improving health outcomes. The seven systematic reviews which did not conclude that app-based health interventions were effective reported inconclusive results as some studies showed effectiveness and others did not35,51,53,54,57,61, or reported clinically irrelevant improvements41. Reported synthesized outcomes, types of effect estimates, and number of underlying individual studies were heterogeneous. A complete overview of extracted results and summaries of author’s conclusions is shown in Supplementary Table 6. For example, for medication adherence, meta-analysed effect estimates reported in 6 systematic reviews ranged between 0.38 and 0.8 standardized mean difference, with 2−14 studies summarized, 6 out of 6 meta-analysed point estimates suggesting an increase in medication adherence, and 6 out of 6 meta-analytic results suggesting statistically significant effects. Three reviews additionally expressed effect estimates for medication adherence in terms of Odds Ratios or mean differences. For HbA1c, meta-analysed effect estimates from 13 systematic reviews ranged between 0.06% and −0.6% (weighted) mean difference, with 2−24 studies summarized, 27 out of 28 meta-analysed point estimates suggesting a reduction in % HbA1c, and 18 out of 28 meta-analytic results suggesting statistically significant effects. For systolic blood pressure (SBP), meta-analysed effect estimates from 9 systematic reviews ranged between 0.1 and −8.12 mmHg (weighted) mean difference, with 2−13 studies summarized, 8 out of 10 meta-analysed point estimates suggesting a reduction in SBP, and 4 out of 10 meta-analytic results suggesting statistically significant effects. Two reviews additionally expressed effect estimates for SBP in terms of Odds Ratios or mean differences. In two reviews with meta-analysed results on SBP the outcome unit was unclear.
link


