
Predictors of the continuous use of an infectious disease self-management app for epidemiological investigations: a survey of young and middle-aged adults in South Korean citizens | BMC Health Services Research

Infectious disease self-management mobile apps: KODARI and MEDARI
We developed the KODARI and MEDARI apps [8, 9]. Both are smartphone apps for the self-management of infectious diseases such as COVID-19, via a bottom-up approach. The two have the same main functions, but KODARI was developed for use in Korea, based on Naver Map. MEDARI is an alternate version developed in English based on Google Maps. In this study, we conducted a usability evaluation for the KODARI app (Fig. 1).

Main pages of the KODARI and MEDARI apps [8, 9]
Both apps record user movements, conditions, and unusual matters to promote the self-management of infectious diseases, and make the recorded data available for epidemiological investigations. The main function of the app is to provide epidemiological investigation support through location information and storage of infectious disease history.
During an actual epidemiological investigation, it may be difficult for users to remember all of their movements over a certain time period. Therefore, the app stores movement information—including location information—and can send the information to the user or to epidemiologists through the “export record” function. Users can also manage their personal health information using these apps. Daily symptom information, including of any underlying diseases, can also be recorded.
Questionnaire development
We developed a 40-item questionnaire for the KODARI app users, to determine their acceptance rates for the app and investigate the factors affecting their continuous intention to use it.
The questionnaire was designed to be administered after using the KODARI app for more than 2 weeks, and included items related to user acceptance and the factors influencing it. The questionnaire consisted of nine demographic and COVID-19-related questions, two usability-related descriptive questions, and twenty-nine multiple-choice questions. Two usability-related questions are open questions. The remaining 38 questions in the questionnaire are closed-ended.
This study used 5 point Likert scale for questionnaire selections which has a scale from 1 to 5 was used, with (1) Strongly Disagree; (2) Disagree; (3) Neither Agree nor Disagree; (4) Agree; (5) Strongly Agree. The main factors of the questionnaire were: (1) performance expectancy, (2) effort expectancy, (3) social influence, (4) facilitating conditions, (5) price value, (6) continuous intention to use, and (7) satisfaction. All variables were derived by reviewing the existing research, and the main definitions and sources are listed in Table 1. Four variables were obtained from the Unified Theory of Acceptance and Use of Technology (UTAUT): performance expectancy, effort expectancy, social influence, and facilitating conditions [10]. These were then adjusted to fit the research topic.
Performance expectancy is the degree to which an app user believes that using an app will help them overcome infectious diseases [10,11,12]. Effort expectancy refers to the degree to which users perceive an app as easy to use [10,11,12]. Social influence measures the degree to which a user perceives that ‘important others’ believe they should use the app [10, 11, 13]. Facilitating conditions refers to the degree to which a user believes that services exist to support the use of an app [10,11,12]. Price value is the degree to which users perceive an app’s usage fee as reasonable [14,15,16]. We used continuous intention to use to determine how accepting the users were of the KODARI app. Continuous intention to use refers to the degree to which a user continuously intends to use an app [17,18,19]. Lastly, satisfaction refers to the degree to which the user is satisfied with the quality or service delivered by an app [18, 21, 22]. All of the questionnaire factors and items are listed in Appendix Table 1. The questionnaire was developed for this study.
Participants and participation criteria
Our survey targeted Korean adults aged 20 or older who owned smartphones that used Android-based operating systems. Basically, over 20 is legally adult in Korea. It was conducted between November 15 and December 14, 2022.
The participants were recruited from panels of online survey company. Each participant has compensation from the survey company’s online coupon which amount is about KRW 10,000 ($7.73, the average exchange rate in 2022: $1293.68). The survey does not require any other external requirements. The KODARI app was distributed to the recruited participants, who were then authorized to use it. After each participant received and signed the consent form to participate in the study, the app APK installation file was delivered to them.
We also delivered five tasks to each participant, so that they could use and understand the app accurately over the initial 2-week period. These tasks were determined based on the main functions of the app (Table 2). Four participating researchers (two doctoral levels, one master’s level, and one bachelor’s level) checked five tasks to each participant.
One researcher checked whether the five tasks had been completed once every 2–3 days for two weeks, in order to determine whether the app was actually being used. The app’s administrator site was built to check participants’ tasks systematically. One researcher checked whether participants are performing tasks well through the app’s administrator site.
The items checked to determine task completion included: (1) whether data donation had been approved by participant over the 2-week period, (2) whether the participant has a confirmed case of COVID-19, (3) the number of MyData information registrations by participant, (4) the number of registered symptom records by participant, and (5) the number of movement exports by participant. There were 144 people who failed to complete at least one of the five tasks, and we excluded them. The survey was conducted only on those participants who had used the app for more than 2 weeks and completed all of their assigned tasks.
Online survey
Participants were recruited between November 15 and 17, 2022. The app usage verification period was from November 15 to December 1, 2022. The survey was conducted only for users who were judged to have used the app for at least 2 weeks. The survey period was December 2–14, 2022.
A total of 784 participants expressed willingness to use the KODARI app and participated in the survey. Of these, 412 participated in the survey and installed the app. A total of 268 users completed all five tasks. The questionnaire was distributed to these participants. Twenty did not respond, so 248 valid questionnaires were ultimately analyzed. Figure 2 illustrates the online survey process.
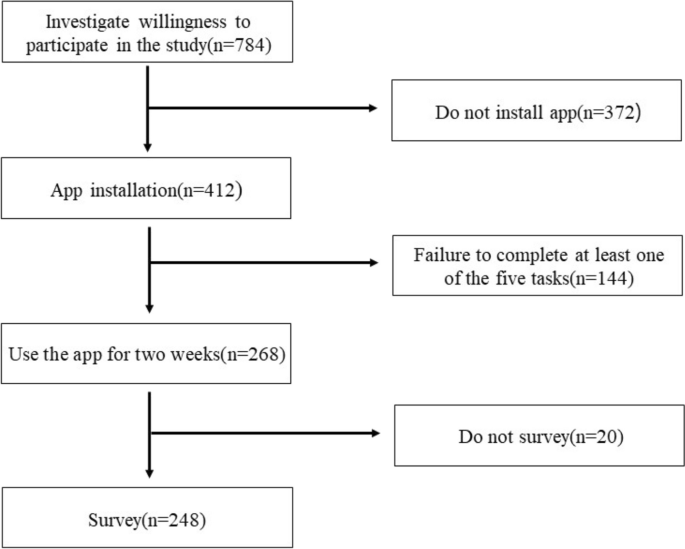
Study progression flowchart
Statistical analysis
Data was analyzed using IBM SPSS Statistics version 27.0 (IBM Corp.). We conducted a frequency analysis to understand the demographic and COVID-19-related characteristics of the participants. The reliability and validity of the measurements were evaluated using factor analysis and Cronbach’s alpha. We conducted a principal component analysis on the seven factors used in the research hypothesis: (1) price value, (2) performance expectancy, (3) facilitating conditions, (4) effort expectancy, (5) satisfaction, (6) social influence, and (7) continuous intention to use. The Varimax method was used for factor analysis.
We also conducted a multiple regression analysis to identify the dependent variables affecting continuous intention to use the app (the dependent variable). We used the enter method to analyze all selected independent variables.
This study conducted two independent-samples t-tests to determine whether there were any significant differences in the perception of each variable in relation to demographic and COVID-19 characteristics: (1) COVID-19 confirmation experience, (2) experience using infectious disease-related apps, (3) sex, (4) marital status, and (5) location. Among demographic characteristics, the entire country was divided into metropolitan areas and non-metropolitan areas. Marital status was divided into single and married. Before the two independent-samples t-tests, this study checked the normality and homoskedasticity. In case of normality, it can be examined based on skewness and kurtosis based on the study of West et al. (1995) [23]. It is judged to have normality if the absolute value of skewness is less than 2 and the absolute value of kurtosis is less than 7 [23]. We calculated kurtosis and skewness for the between-group items based on these criteria, and all values met the criteria of West et al. (1995) [23].
Ethics
The study procedures were carried out in accordance with the Declaration of Helsinki and were approved by the Institutional Review Board of Dankook University (IRB number: 2021-12-009). Participants’ data were de-identified. We obtained informed consent online from all participants prior to participating in the survey.
link


