Effectiveness of mobile application interventions for stroke survivors: systematic review and meta-analysis | BMC Medical Informatics and Decision Making

Study selection
The screening procedure along with the criteria for excluding papers is shown in the PRISMA flow diagram (Fig. 1). The search retrieved 4185 citations, of which 2899 duplicates were removed. After exclusion of duplicates, a total of 1286 records were consequently assessed against the inclusion and exclusion criteria, and 45 full-text manuscripts were reviewed for eligibility. Of these 45 articles, 22 studies were excluded for several reasons. Therefore, a total of 23 records were included in this review.
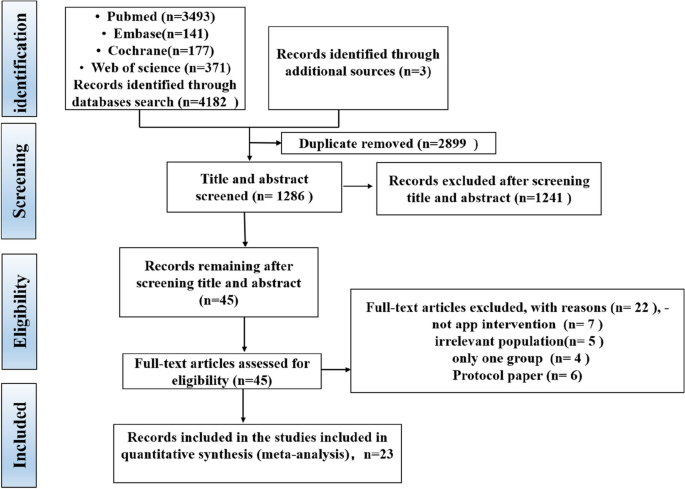
The PRISMA (Preferred Reporting Items for Systematic Reviews and Meta-Analyses) flow diagram
Quality of study
Figures 2 and 3 show the risk of bias judgment of RCTs. Thirteen studies [6, 11, 23,24,25,26,27,28,29,30,31,32,33] presented specific random sequence generation methods. Five trials [12, 34,35,36,37] that did not provide sufficient details about the randomisation method were rated as unclear with regard to random sequence generation. Allocation concealment was rated as low risk of bias in 10 trials [6, 12, 23,24,25, 27, 29, 31,32,33] (55.6%) and unclear in seven trials [11, 26, 28, 30, 35,36,37] (38.9%). Given the nature of mobile application interventions, blinding of study participants and health care personnel is not feasible, which inevitably causes performance bias. In total, 16 trials [6, 11, 12, 23,24,25,26,27,28,29,30,31,32,33, 35, 36] had a low risk of incomplete outcome data, whereas only seven trials [11, 25, 29,30,31,32,33] had a low risk of selective outcome reporting. The dropout and attrition rates were acceptable.
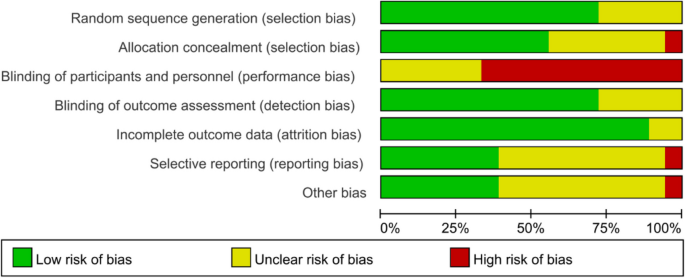
Risk of bias graph for RCTs: review authors’ judgments about each risk of bias item presented as percentages The x-axis represents the percentage of studies that were found to be of low (green), unclear (yellow), or high (red) risk of bias for each domain
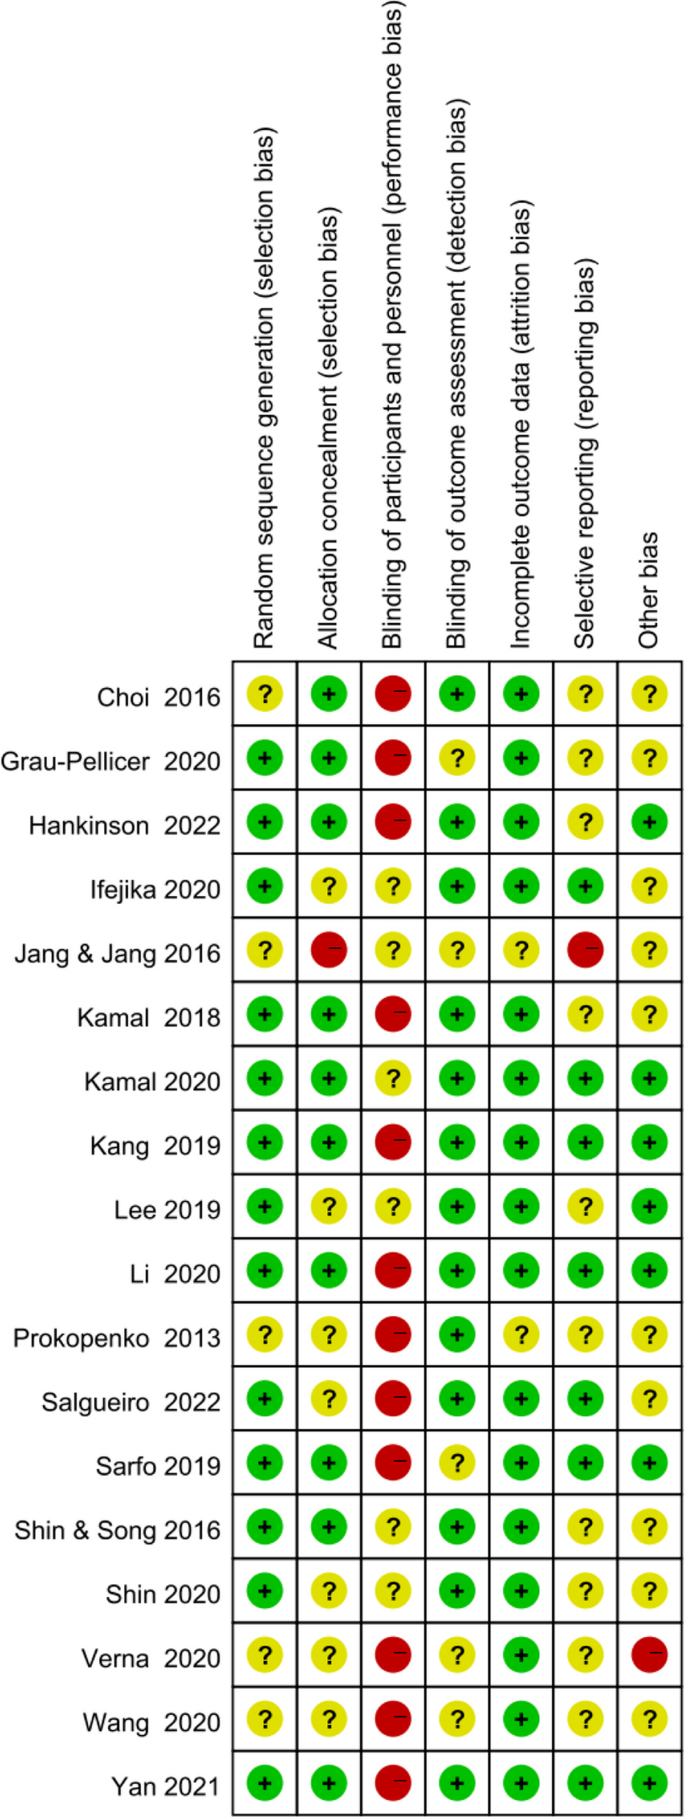
Risk of bias summary of RCTs
Figures 4 shows the risk of bias of CCTs. Staggered recruitment time between the control and intervention groups resulted in little confounding bias. There was selection bias due to convenience sampling method used in 2 studies [38, 39]. Bias in the classifcation of interventions might be caused by lacking of random sampling and random grouping. There were bias due to deviations from intended interventions because the nature of mHealthl interventions. There were no significant sample loss and measurement bias. Generally, the quality of the included studies was acceptable.
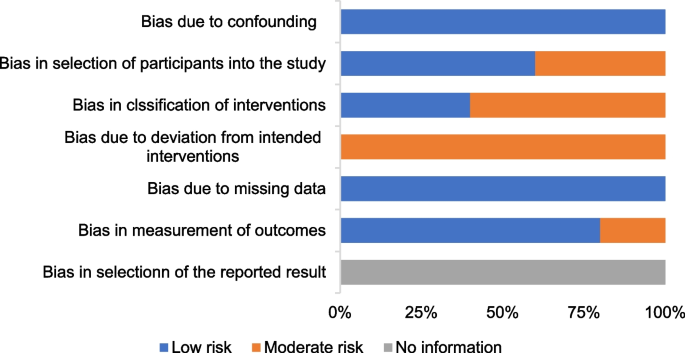
Risk of bias graph for CCTs: review authors’ judgments about each methodological quality item of ROBINS-I presented as percentages
Characteristics of the included studies
Table 1 summarises the specific information extracted from the included studies.
Twenty-three studies were published between 2013 and 2022 (82.6% in 2018 or later). All the included studies compared one app alone or app in conjunction with a package of participant support with a control arm. A total of 2983 participants were included, with sample sizes ranging from 21 [34] to 1226 [31]. Five studies [31,32,33, 35, 42]were conducted in China; four in Korea [12, 27, 28, 34]; three in Spain [23, 30, 43]; two in Austria [24, 41], USA [11, 29] and Pakistan [6, 25] and one in Russia [37], United Kingdom [38] and Italy [36]. Eighteen studies [6, 11, 12, 23,24,25,26,27,28,29,30,31,32,33,34,35,36,37] were RCTs, and five [38, 39, 41,42,43] were CCTs. Seventeen articles [6, 12, 23, 25,26,27,28, 30,31,32,33,34,35, 37, 39, 42] presented clinical outcomes, whereas six articles[11, 24, 29, 38, 41, 43] were pilot studies. Regarding the intervention duration of the studies, eight lasted ≤ 1 month [12, 27, 28, 32, 34, 36, 37, 43], four [23, 24, 26, 38] lasted 1–3 months, and eleven [6, 11, 25, 29,30,31, 33, 35, 39, 41, 42] lasted ≥ 3 months. The participants in the studies were primarily young and middle-aged stroke survivors, and only four studies primarily involved patients 60 years or older [12, 23, 26, 42]. More than half of the studies had a sample of less than 50 participants.
The control group received usual care without the use of the app in 14 trials [6, 12, 24,25,26,27,28, 30, 31, 34, 37, 38, 41, 43], SMS messages in one trial [29], a printed handout [39] or health brochure [32, 42] or pocket-sized material [11] in four trials, telephone follow-up in two trials [33, 35] and the same app compared with the intervention group but with different functionality in one trial [36].
Involvement of HCPs and measures to ensure app-based intervention adherence
Sixteen trials [6, 11, 23, 24, 26, 29,30,31,32,33, 37,38,39, 41,42,43] involved HCPs in app use, and the remaining seven trials [12, 25, 27, 28, 34,35,36] did not specify information of HCPs involved in app use (Table 1). The involvement of HCPs varied; most of the trials involved HCPs to prescribe patient’s rehabilitation training [24, 33, 38], guide the training [23, 26, 30, 37, 39], instruct patients on how to use the app or measure blood pressure using the BP device and remind patients to use the app [6, 29,30,31,32, 41,42,43].
Only seven trials reported measures to ensure app-based intervention adherence; the measurements include setting and evaluating goals once a week [41], sending constant SMS reminders [25] performing regular phone calls [30, 39, 42] and conducting follow-up visit [31, 38].
App characteristics
A total of 18 different mobile applications were used across the studies, and four did not provide respective information of the app. The functionality of the apps varied across different trials. Mobile applications were used for three target areas amongst stroke survivors: three in education [25, 31, 32], nine in self-care [6, 11, 23, 29, 35, 38, 41,42,43] and 11 in rehabilitation [12, 24, 26,27,28, 30, 33, 34, 36, 37, 39].
With regard to education, one app delivered 5-min videos on various stroke-related topics, which was developed by biomedical and software engineers of Aga Khan Development Network Electronic Health (eHealth) Resource Center in collaboration with stroke specialists, rehabilitation and swallowing experts and epidemiologists [25]. One app delivered a tailored motivational SMS text message [31], and one app has a stroke health-education content covering 12 topics of risk factors in patients with stroke (e.g. stroke history and hypertension), which can be browsed by participants for several times without time and location limitation [32]. With regard to self-care, the majority of apps have a self-monitoring function or medication reminder, health information, assessment, feedback, health service and social support. As for rehabilitation, apps can detect a variety of physical activities and transmit rehabilitation-related data to the server computer, which are shared with the therapist. Most of these apps need other devices to achieve these functions. In addition, some apps help patients to obtain access to visual and auditory feedback on their excise by viewing the display on the screen of synchronous equipment. App characteristics are outlined in Table 2.
Intervention effectiveness
Medication adherence
Two studies with a total of 257 patients were included in the meta-analysis. The two studies used 8-item Morisky Medication Adherence Scale 8 to assess medication adherence. Inverse-variance-weighted linear meta-analysis of MD (Hedge’s g) on these studies revealed a medium effect size of 0.19 favouring mobile application, but MD was not significant (0.19, 95% CI [− 0.08, 0.47]; P = 0.17; Fig. 5).

Meta-analysis results and forest plot of the effect of app-based interventions on medication adherence
Functional outcomes
An array of functional outcomes was measured across the trials, which included a 10-min walk test (10 MWT), Barthel index, Fugl–Meyer assessment (FMA-LE), trunk control ability and Fugl–Meyer assessment of the upper extremity (FMA-UE). Two studies with a total sample size of 64 subjects were included in meta-analysis to assess the effect of mobile application on 10 MWT. Meta-analysis for 10 MWT (Fig. 6) demonstrating a non-significant effect in favour of the app intervention (MD 0.24, 95% CI [− 0.22 to 0.70]; P = 0.30), with a high statistical heterogeneity (I2 = 93%).

Meta-analysis results and forest plot of the effect of app-based interventions on 10 MWT
Data on trunk control ability were available in two trials (48 patients), which all used the trunk impairment scale. The results indicated that mobile application interventions could improve the trunk control ability of stroke survivors (MD 3, 95% CI [1.80 to 4.2]; P < 0.00001), with no statistical heterogeneity (I2 = 0%, Fig. 7).

Meta -analysis results and forest plot of the effect of app-based interventions on trunk control
The overall effect (Fig. 8) revealed that mobile application-based intervention could effectively improve FMA-UE, and the forest plot showed no heterogeneity amongst studies (MD 9.81, 95% CI [8.72 to 10.90]; P <0.00001), with no statistical heterogeneity (I2 = 0%).

Meta-analysis results and forest plot of the effect of app-based interventions on FMA-UE
Meta-analysis for FMA-LE and Barthel index all favoured the use of an app, but no statistical differences in FMA-LE (MD 3.92, 95% CI [1.91to 9.75]; P = 0.19; Fig. 9) or Barthel index (MD 9.39, 95% CI [−0.51 to 19.28]; P = 0.06; Fig. 10) were observed between the intervention and control groups.

Meta-analysis results and forest plot of the effect of app-based interventions on FMA-LE

Meta-analysis results and forest plot of the effect of app-based interventions on Barthel index
Cardiovascular risk factor
Cardiovascular risk factors included systolic blood pressure (SBP), diastolic blood pressure (DBP), high-density lipoprotein cholesterol (HDL-C), low-density lipoprotein cholesterol (LDL-C), body mass index (BMI), smoking and glycosylated haemoglobin A1c (HbA1c). Analysis showed significant differences in LDL-C (MD − 0.33, 95% CI [− 0.54 to − 0.11]; P = 0.003) and HbA1c < 7 levels (MD 1.95, 95% CI [1.17 to 3.25]; P = 0.01). Amongst the outcomes that were reported by more than one study, no significant difference in modifying HDL-C (MD 0.31, 95% CI [− 0.06 to 0.96]; P = 0.10), BMI (MD − 1.93, 95% CI [− 5.15 to 1.30]; P = 0.24) and smoking (MD 1.82, 95% CI [0.80 to 4.13]; P = 0.15; Fig. 11) was observed between the intervention and control group.
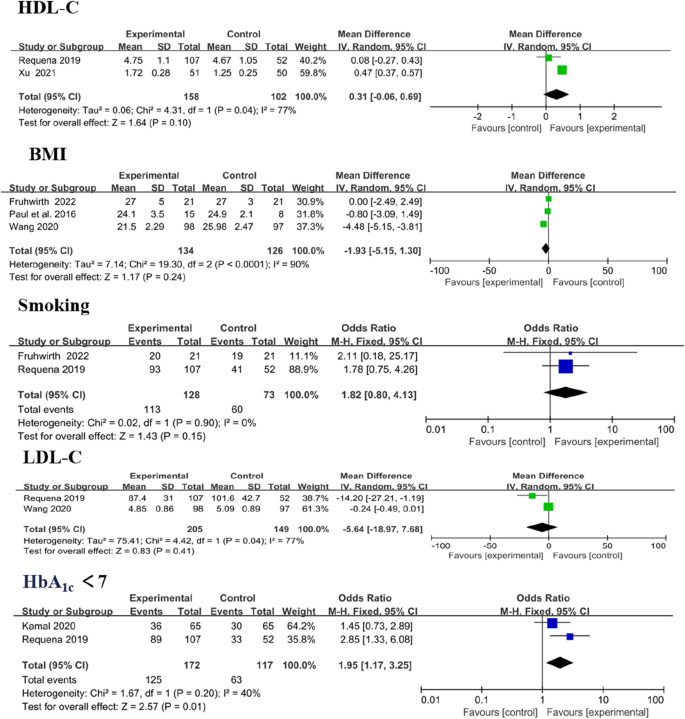
Forest plots of HDL-C, BMI, smoking, LDL-C and HbA1c < 7 results
Three trials reported SBP and DBP as outcomes, [38, 41, 43] with no significant change. In overall effect analysis, no significant differences in DBP (MD 1.76, 95% CI [− 2.07 to 5.58]; P = 0.37) or SBP (MD − 1.40, 95% CI [− 5.39 to 2.59]; P = 0.49) were observed between the two groups (Fig. 12).
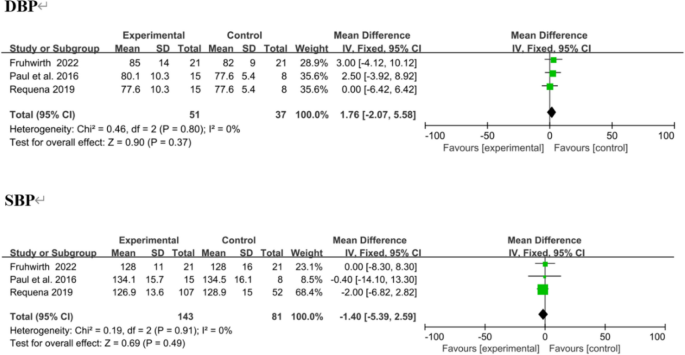
Forest plots of DBP and SBP results. Negative MDs between the two groups favour the mobile application-based intervention
Quality of life (QoL)
Qol was evaluated in four trials, using the European Quality of Life–Five Dimensions (EQ-5D) and the Stroke Specific Quality of Life Scale (SS-QOL). The integrated results showed no significant difference in QoL between the two groups (MD = − 0.09, 95% CI = − 0.93 to 0.76, P = 0.84; I2 = 83%, P = 0.0006; Fig. 13).

Forest plots of Qol results
Knowledge of stroke
Two trials assessed the effectiveness of the mobile application on knowledge of stroke. The tools used to assessed knowledge on stroke were the14-item hypertension and stroke knowledge questionnaire score [29] and stroke-knowledge questionnaire [32]. Meta analysis for these two studies of 123 participants (intervention n = 60, control n = 63) showed that mobile application interventions did not exert a statistically significant effect on knowledge of stroke (MD = − 0.05, 95% CI = − 0.40 to 0.31, P = 0.79; Fig. 14).

Forest plots of knowledge of stroke results
link


