Prognostic effectiveness of interactive vs. non-interactive mobile app interventions in type 2 diabetes: a systematic review and meta-analysis | Archives of Public Health

Descriptions of studies
A systematic literature search yielded a total of 1,172 articles from PubMed (n = 179), Cochrane (n = 668), Embase (n = 35), and Web of Science (n = 290) databases. After removing 332 duplicates, 840 titles and abstracts were initially selected. Finally, 15 articles were included, reporting 17 studies [17, 18, 25,26,27,28,29,30,31,32,33,34,35,36,37]. The literature search process is illustrated in Fig. 1.
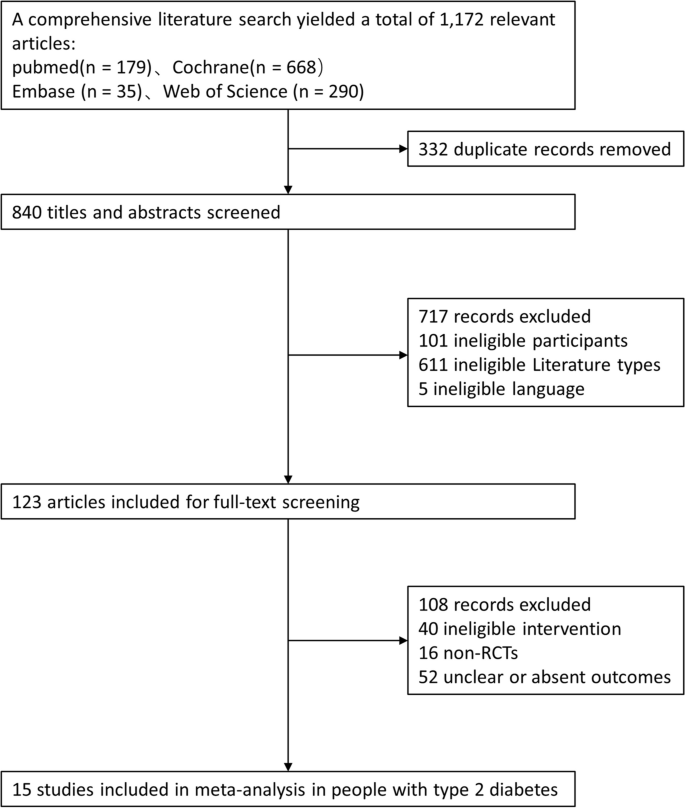
Flow diagram for articles included in interactive vs. non-interactive mobile app interventions in type 2 diabetes (searched up to april 18, 2024)
Appendix table 3 provides a summary of the details pertaining to the 17 trials, with a total of 2,028 subjects (1,123 in the intervention group and 905 + 71 + 44 in the control group) included in the combined analysis. Geographically, 3 studies were conducted in China, 2 in Korea and Indonesia, and 1 each in Colombia, India, Sweden, the United Kingdom, Iceland, Switzerland, Iran, and Norway. The largest number of studies were conducted in Asia, totaling 9. Regarding the duration of publication, the years spanned from 2014 to 2024, with the highest number of publications recorded in 2019 and 2022 (four articles in each year). Over the past five years, 10 articles have been published. In terms of intervention duration, the range was between 3 and 6 months, with a mean duration of 4.35 months. Concerning the nature of the interventions, 7 of the study interventions were interactive, as detailed in Appendix table 3.
Risk bias
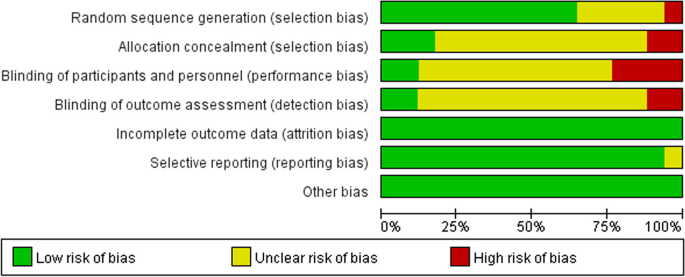
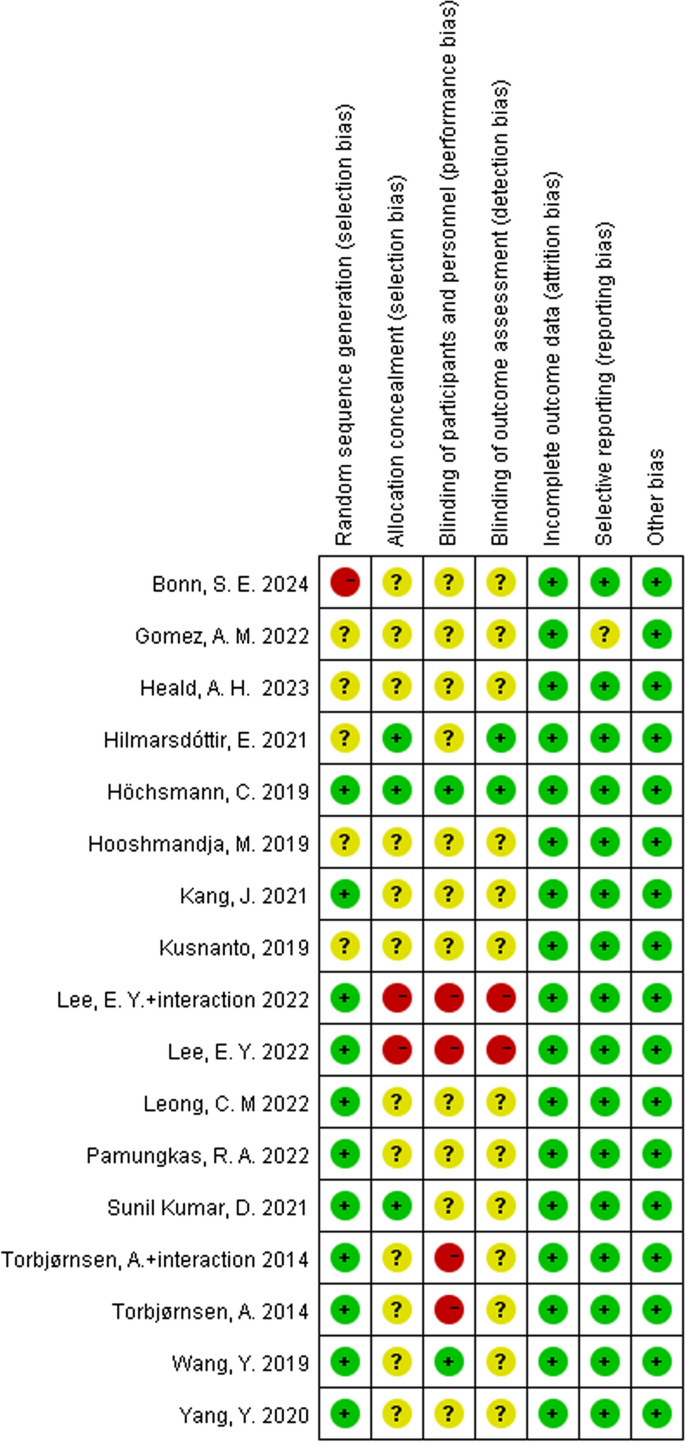
In terms of the method of randomisation, nine articles were deemed to have a low risk of bias, while only one article was considered to be at high risk. The method of randomisation was unclear in five articles. Regarding the concealment of allocation, eleven articles were unclear, one article was rated as high risk, and three articles were rated as low risk. Given the specificity of mobile app digital interventions, the majority of studies were unable to be blinded to researchers, subjects, or measurers. Consequently, for “blinding of investigators and subjects,” there were two low-risk, two high-risk, and eleven unclear cases. For “blinding of measurers,” there were two low-risk, one high-risk, and twelve unclear cases.In terms of selective reporting of findings, only one article was identified as unclear, while the remainder were classified as low risk. Similarly, all articles were assigned a low-risk rating for completeness of outcome data and other sources of bias. Figures 2 and 3 illustrate the risk of bias results.
Results of meta-analysis of clinical indicators
Effect on HbA1c (glycated hemoglobin)
Sixteen studies reported HbA1c intervention data, including 1,034 cases in the intervention group and 940 cases in the control group. Meta-analysis indicated that, compared with the control group, the intervention group showed a significant reduction in HbA1c levels (SMD − 0.24; [95% CI, -0.33, -0.15]). The results were statistically significant. Qualitative analysis (I² = 48%, P < 0.00001) (Fig. 4A) and visual assessment of the funnel plot showed no publication bias, with the Egger test yielding p = 0.251, indicating no statistically significant publication bias (Fig. 5A).
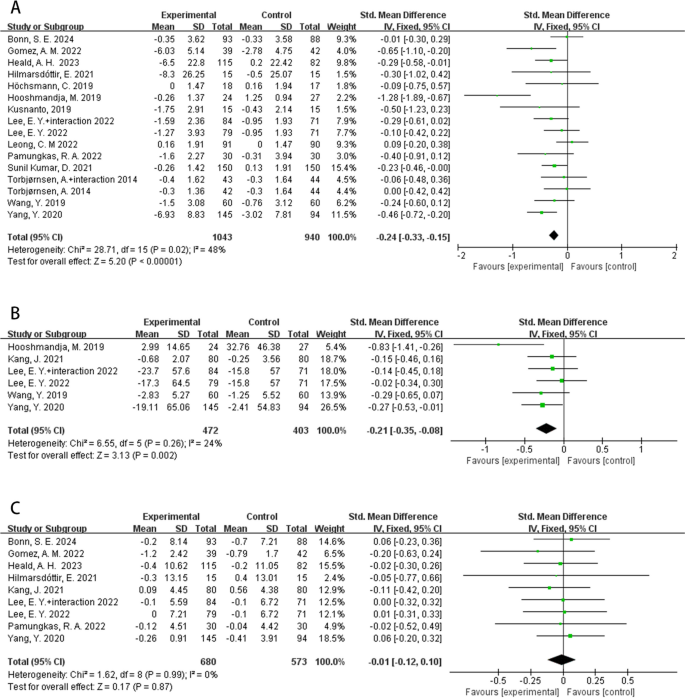
Forest plots of (a) hba1c, b fpg, c bmi for interactive vs. non-interactive mobile app interventions in type 2 diabetes
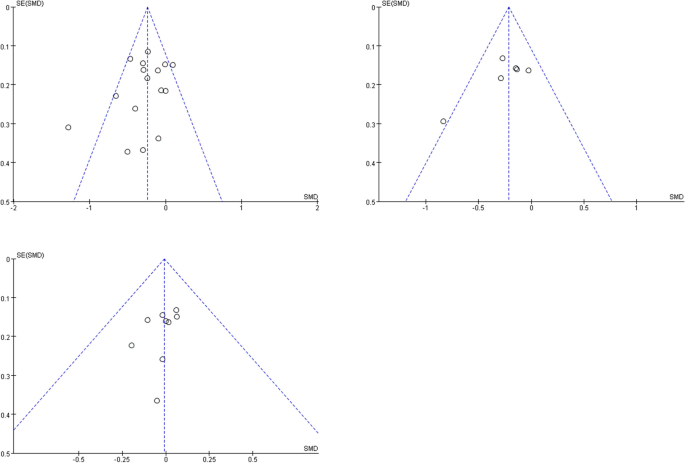
Funnel plots of (a) hba1c, b fpg, c bmi for interactive vs. non-interactive mobile app interventions in type 2 diabetes
Although no obvious heterogeneity was observed in HbA1c, we conducted a subgroup analysis using it as the main evaluation criterion (Table 1). The table reveals that mobile application interventions, whether interactive or non-interactive, resulted in a statistically significant reduction in HbA1c levels. However, the heterogeneity increased for non-interactive mobile applications (I² = 55%).Regarding the duration of intervention, both groups showed a statistically significant reduction, with a more pronounced effect observed when the intervention duration was ≤ 3 months. Nevertheless, the heterogeneity increased significantly (SMD − 0.37; [95% CI, -0.53, -0.21], I² = 76%, P < 0.00001). In terms of region, the intervention effect in Asia was more significant (SMD = -0.27), although the heterogeneity increased (I²=61%). The intervention in Europe showed no statistical significance. Considering average age, the intervention effect was more significant for individuals with an average age < 55 years (SMD = -0.30) compared to those with an average age ≥ 55 years (SMD = -0.19), with no observed heterogeneity.
Effect on FPG (fasting plasma glucose)
In the context of the FPG meta-analysis, a total of six studies reporting results were included, involving 472 cases in the intervention group and 403 cases in the control group. Compared with the control group, the intervention group showed a significant reduction in FPG levels (SMD − 0.21; [95% CI, -0.35, -0.08]). The results were statistically significant and showed no significant heterogeneity (I² = 24%, P = 0.002) (Fig. 4B). Although there was a slight publication bias in the visual assessment of the funnel plot, the Egger test yielded a p-value of 0.132, indicating no statistically significant publication bias (Fig. 5B).
Effect on BMI (body mass index)
A total of nine studies reported BMI data, which included 680 cases in the intervention group and 573 cases in the control group. The meta-analysis revealed no significant difference in BMI between the two groups (SMD − 0.01; [95% CI, -0.12, 0.10]), indicating that the intervention did not have a statistically significant effect on BMI. Additionally, there was no heterogeneity observed among the studies (I² = 0%, P = 0.87) (Fig. 4C). Although the visual assessment of the funnel plot suggested slight publication bias, the Egger’s test showed a p-value of 0.225, indicating that there was no statistically significant publication bias (Fig. 5C).
Effect on TG (Triglyceride)
There were five studies investigating changes in TG, with 286 cases in the intervention group and 229 cases in the control group. The meta-analysis revealed no statistically significant difference between the two groups in terms of triglyceride levels (SMD − 0.02; [95% CI, -0.20, 0.15]), indicating that the intervention had no effect on triglycerides. Furthermore, there was no observed heterogeneity among the studies (I² = 0%, P = 0.81) (Fig. 6A). Although the visual assessment of the funnel plot suggested slight publication bias, the Egger’s test showed a p-value of 0.284, indicating that there was no statistically significant publication bias (Fig. 7A).
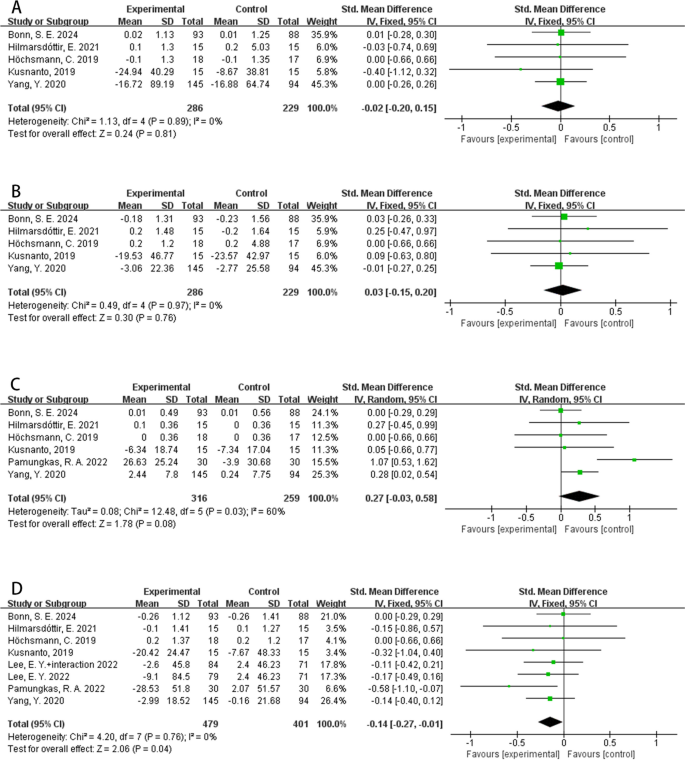
Forest plots of (a) tg, b tc, c hdl, d ldl for interactive vs. non-interactive mobile app interventions in type 2 diabetes
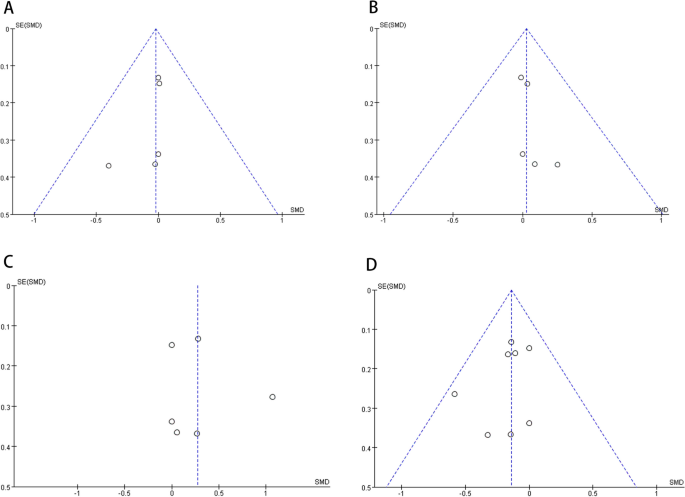
Funnel plots of (a) tg, b tc, c hdl, d ldl for interactive vs. non-interactive mobile app interventions in type 2 diabetes
Effect on TC (Total cholesterol)
Five studies investigated changes in TC, involving 286 patients in the intervention group and 229 patients in the control group. The meta-analysis revealed no statistically significant difference between the two groups in terms of total cholesterol levels (SMD 0.03; [95% CI, -0.15, 0.20]), indicating that the intervention had no effect on total cholesterol. Additionally, there was no observed heterogeneity among the studies (I² = 0%, P = 0.76) (Fig. 6B). The visual assessment of the funnel plot indicated a slight publication bias (Fig. 7B), though the Egger’s test showed a p-value of 0.211, suggesting that there was no statistically significant publication bias.
Effect on HDL (high-density lipoprotein)
In the context of the meta-analysis of HDL, a total of six studies were included, which comprised 316 participants in the intervention group and 259 participants in the control group. The meta-analysis indicated that there was no statistically significant difference in HDL levels between the two groups (SMD 0.27; [95% CI, -0.03, 0.58]), and there was significant heterogeneity among the studies (I² = 60%, P = 0.08) (Fig. 6C). Visual inspection of the funnel plot suggested the presence of publication bias (Fig. 7C), but the Egger’s test showed that this bias was not statistically significant (p = 0.691).Sensitivity analysis (Fig. 8A) revealed that the study by Bonn, S.E. (25) et al., published in 2024, was a major contributor to the instability of the overall HDL results. After excluding this study, the meta-analysis showed a statistically significant higher HDL level in the intervention group compared to the control group, and the heterogeneity was reduced (SMD 0.36; [95% CI, 0.00, 0.72], I² = 55%, P = 0.05). This suggests that the data from Bonn, S.E. may have been a significant source of heterogeneity in HDL studies.
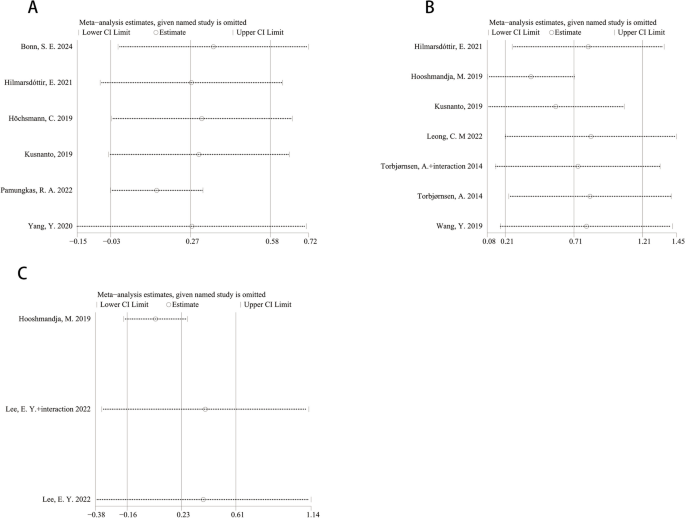
Sensitivity analysis plots for interactive vs. non-interactive mobile app interventions in type 2 diabetes: a hdl, b diabetes self-care, c steps
We performed subgroup analyses based on intervention modality, intervention duration, intervention region, and age group of the participants. We found differences primarily in the subgroup with a mean age of < 55 years. The results of the subgroup analyses are as follows: (1) Intervention Modality: The mobile app group without interaction (SMD 0.04; [95% CI, -0.20, 0.27], I² = 0%, P = 0.77) and the mobile app group with interaction (SMD 0.64; [95% CI, -0.13, 1.41], I² = 85%, P = 0.10) were both ineffective at significantly increasing HDL levels compared to the control group. (2) Intervention Duration: For interventions lasting > 3 months, there was no heterogeneity and no statistical significance (SMD 0.03; [95% CI, -0.22, 0.28], I² = 0%, P = 0.80). Conversely, for interventions lasting ≤ 3, there was significant heterogeneity and no statistical significance (SMD 0.48; [95% CI, -0.08, 1.03], I² = 74%, P = 0.09). (3) Publication Region: In Asia, the results showed significant heterogeneity and no statistical significance (SMD 0.48; [95% CI, -0.08, 1.03], I² = 74%, P = 0.09). In Europe, the results showed no heterogeneity but were not statistically significant (SMD 0.03 mmol/L; [95% CI, -0.22, 0.28], I² = 0%, P = 0.80). (4) Average Age: For studies where the average age was ≥ 55 years, there was significant heterogeneity and no statistical significance (SMD 0.55; [95% CI, -0.50, 1.60], I² = 83%, P = 0.30). In contrast, for studies where the average age was < 55 yeed to the control group, with no heterogeneity (SMD 0.28; [95% CI, 0.04, 0.53], I² = 0%, P = 0.02). The remaining subgroup analyses are detailed in Table 1.
Effect on LDL (low-density lipoprotein)
Through the screening of studies, a total of eight studies on LDL were included, which comprised 479 participants in the experimental intervention group and 401 participants in the control group. The results of the meta-analysis indicated that the intervention group achieved a significantly greater reduction in LDL levels compared to the control group. This result was statistically significant, with no observed heterogeneity (SMD − 0.14; [95% CI, -0.27, -0.01], I² = 0%, P = 0.04) (see Fig. 6D). Additionally, visual inspection of the funnel plot did not reveal obvious publication bias (Fig. 7D), and the Egger’s test showed no statistically significant publication bias (p = 0.346). Analysis of LDL subgroups revealed no significant heterogeneity across any of the subgroups.
Effect on SBP (Systolic Blood Pressure)
Five studies reported data on the effects of SBP, including 363 patients in the intervention group and 307 patients in the control group. For the effect size of SBP, we observed: SMD − 0.16; [-0.32, -0.01], which is a clinically meaningful effect size and the intervention group was better than the control group in redu`cing SBP levels; in addition, we also observed I² = 24%, P = 0.04, this report has no significant heterogeneity and is statistically significant (Fig. 9A). There was a slight publication bias in the visual analysis of the funnel plot, p = 0.854 by Egger test, and there was no publication bias statistically (Fig. 10A). Subgroup analysis is shown in Table 2.
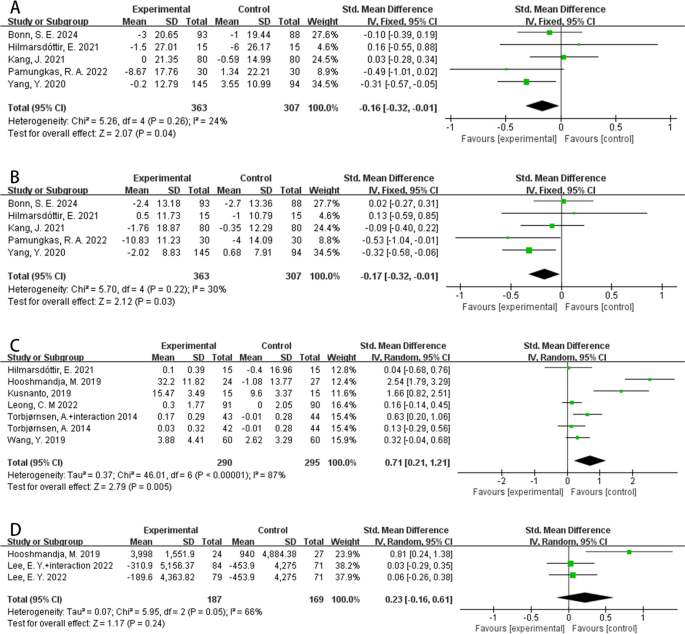
Forest plots of (a) sbp, b dbp, c diabetes self-care (d) steps for interactive vs. non-interactive mobile app interventions in type 2 diabetes
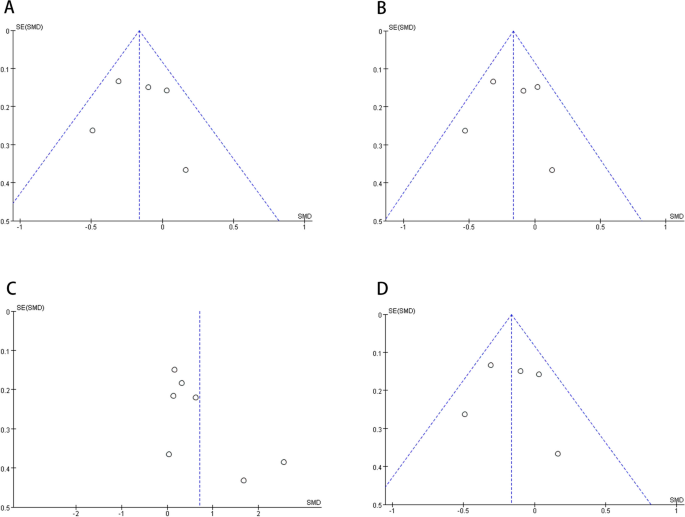
Funnel plots of (a) sbp, b dbp, c diabetes self-care, d steps for interactive vs. non-interactive mobile app interventions in type 2 diabetes
Effect on DBP (diastolic blood pressure)
A total of five studies reported on DBP, including 363 patients in the intervention group and 307 patients in the control group. The meta-analysis results showed that DBP levels in the intervention group were significantly lower compared to those in the control group (SMD − 0.17; [95% CI, -0.32, -0.01], I² = 30%, P = 0.03) (Fig. 9B). Although the funnel plot (Fig. 10B) suggested a slight possibility of publication bias, the Egger’s test indicated that there was no statistically significant publication bias (p = 0.970). Subgroup analysis results are presented in Table 2.
Results of DSM (diabetes self-management)
The meta-analysis of DSM included seven studies, with a total of 290 participants in the intervention group and 295 participants in the control group. The results demonstrated a significant improvement in self-management scores in the intervention group compared to the control group (SMD 0.71; [95% CI, 0.21, 1.21], P = 0.005), although the heterogeneity among the studies was high (I² = 87%) (Fig. 9C). The funnel plot analysis indicated a potential risk of publication bias (Fig. 10C), but Egger’s test showed that this bias was not statistically significant (p = 0.08). Sensitivity analysis did not reveal any individual study that significantly affected the overall results (Fig. 8B).
Subgroup analysis revealed that the use of an interactive mobile app significantly increased self-management scores and reduced heterogeneity (SMD 0.33; [95% CI, 0.07, 0.59], I² = 36%, p = 0.01). Additionally, interventions lasting > 3 months showed a statistically significant improvement in self-management scores with reduced heterogeneity (SMD 0.32; [95% CI, 0.09, 0.55], I² = 9%, p = 0.007). Furthermore, interventions conducted in Europe and for participants ≥ 55 years also demonstrated increased self-management scores with decreased heterogeneity (Table 2).
Effect on steps
Three studies reported data on steps(the outcomes related to physical activity levels, measured in step), with 187 participants in the intervention group and 169 participants in the control group. The results indicated that there was substantial heterogeneity among the studies (SMD 0.23; [95% CI, -0.16, 0.61], I² = 66%, p = 0.24) (Fig. 9D), and the intervention had no statistically significant effect on step count. The funnel plot (Fig. 10D) revealed visual evidence of publication bias, and the Egger’s test confirmed a significant publication bias (p = 0.02). However, sensitivity analysis demonstrated that the results were stable (Fig. 8C).
link


